The situation
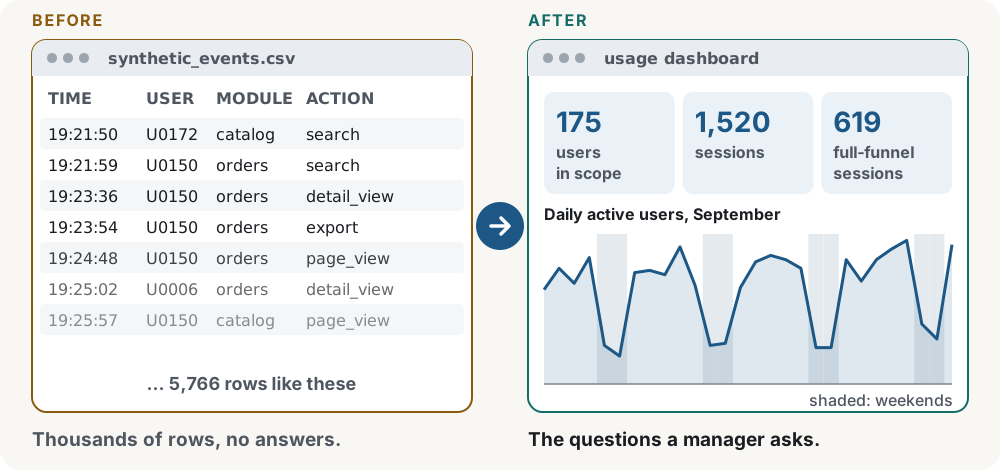
“How many people use the product?” sounds like one question. Daily users, total events and funnel progress give three different answers, and a duplicated or malformed event can quietly change all of them.
This project explores that problem with 28 days of fictional events from an invented B2B web app.
Where this comes from
I expanded live administrator reporting for an industrial B2B business platform to track adoption by role and organization, weekly retention and storage growth, while distinguishing frontend reporting needs from backend data requirements.
Three decisions that shape it
-
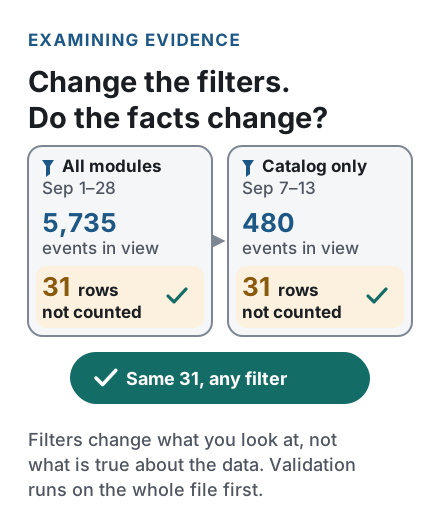
Validate the whole file before any filter.
Exact duplicate events collapse to one, conflicting copies are quarantined and rows with missing or invalid fields are rejected, all before any date or module filter is applied. Changing the view never changes what counts as valid data.
File-wide validation; every raw row gets exactly one outcome.
-
Write down every denominator.
Daily active users are distinct people per day, not the sum of each module’s users, and module share is a share of events, not of people. Each chart states what it counts, and a rate shows N/A instead of a misleading zero when there is nothing to divide by.
Distinct users, events and sessions kept separate; N/A for empty denominators.
-
Count a funnel step only if it happens later.
A session reaches the next step only when that action happens strictly after the previous one. Repeated clicks don’t count twice, and two actions in the same second don’t prove an order.
Session = a (user, session) pair; strictly increasing timestamps.

The result
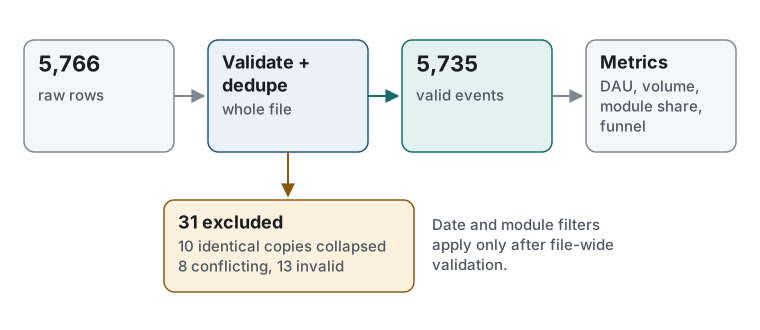
Of 5,766 raw rows, 5,735 are valid and every other row is accounted for: 10 duplicate copies collapsed, 8 quarantined and 13 rejected. In September, 1,357 sessions opened a page, 844 then searched and 619 then viewed a detail: 46% of the sessions that opened a page.
Fewer than half of page-opening sessions reach a detail view
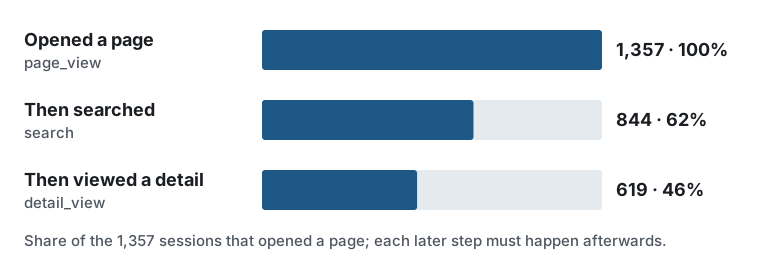
(user_id, session_id) pairs and strictly increasing event timestamps. It is not a user-level conversion rate.What I’d do next
Let users choose the funnel steps and add sessions based on inactivity, so the same definitions can answer more questions.
Technical notes
- Every raw row has exactly one outcome: 5,766 raw = 5,735 valid + 10 collapsed + 8 quarantined + 13 rejected.
- Timestamps must be
YYYY-MM-DDTHH:MM:SSZin UTC with ASCII digits; other offsets are rejected, not converted. - Date filters include the start date from midnight UTC and stop at midnight after the end date.
- The metric code has no Streamlit dependency, so another interface could reuse the same definitions.
- A seeded generator produces byte-identical data on every run; 44 pytest tests, including headless dashboard runs.
From raw events to defensible metrics
My role
I co-developed the original agent prompt kit for this project with AI assistance, and I provided the business context, project purpose and initial architecture outline. I set requirements, evaluation criteria, edge-case priorities and approval decisions.
I used a planner-and-builder AI workflow to produce the implementation and supporting documentation. AI tools performed the implementation work, while I remained responsible for the project's direction and final approvals.
During the first review round, I personally followed the project's run-and-check instructions in PowerShell and confirmed that the outputs matched the agents' reports. Later corrections and their regression results were verified by agents.
What I learned
I learned to connect a metric to the administrator's question before choosing a chart. Distinct users, event volume and funnel progression describe different aspects of activity. Clear populations, time windows, denominators and data-quality diagnostics help administrators interpret those numbers and decide what to investigate next.
Academic connections
These are conceptual connections to the reasoning described in Applied Thinking. They do not claim formal implementation of every theory.